- Sharp year-on-year rise in sales revenue to EUR 160.3 billion (EUR 147.7 billion)
- Negative special items relating to diesel issue of EUR 6.7 billion and in trucks business of EUR 0.2 billion
- Operating profit after special items at EUR 3.3 billion (EUR 9.4 billion)
- Full-year earnings forecast adjusted
- Equity-accounted profit of the Chinese joint ventures stable
- Additional liquidity in excess of EUR 3 billion from sale of Suzuki shares
- Net liquidity in Automotive Division increases to EUR 27.8 billion
- CEO Müller: “We will do everything in our power to win back the trust we have lost”
The Volkswagen Group generated an operating profit before special items of EUR 10.2 billion (EUR 9.4 billion) in the first nine months of the year. Sales revenue grew by 8.5 percent to EUR 160.3 billion. The operating return on sales before special items amounted to 6.4 percent.
Earnings were impacted by charges of EUR 6.7 billion in the third quarter for forth coming measures relating to the diesel issue.
As a result, operating profit after special items amounted to EUR 3.3 billion (EUR 9.4 billion). Profit after tax was EUR 4.0 billion (EUR 8.7 billion). As already announced, the full-year earnings forecast was adjusted accordingly.
“The figures show the core strength of the Volkswagen Group on the one hand, while on the other the initial impact of the current situation is becoming clear. We will do everything in our power to win back the trust we have lost”, said Matthias Müller, Chairman of the Board of Management of Volkswagen Aktiengesellschaft, in Wolfsburgon Wednesday.
The Group’s operating profit and sales revenue exclude the activities of the Chinese joint ventures, which are accounted for in the financial result using the equity method. The share of operating profit attributable to the Chinese joint ventures to the end of September remained level at EUR 3.8 billion (EUR 3.9 billion).
“The Volkswagen Group has very solid and robust liquidity resources. This will help us manage the challenging situation caused by the financial impact of the diesel issue”, said Chief Financial Officer Frank Witter.
Net liquidity rises in the Automotive Division
The Automotive Division’s net cashflow increased considerably year-on-year to EUR 11.8 billion (EUR 5.5 billion) thanks to the Group’s robust business model. Net liquidity in the Automotive Division amounted to EUR 27.8 billion at the end of September (end of December 2014: EUR 17.6 billion). The Automotive Division’s investments in property, plant and equipment, investment property and intangible assets, excluding capitalized development costs (capex) increased to EUR 7.3 billion (EUR 6.5 billion). The ratio of capex to sales revenue in the Automotive Division amounted to 5.3 percent (5.0 percent).
Brands and Business Fields
The Volkswagen brand’s operating profit before special items relating to the diesel issue rose to EUR 2.2 billion (EUR 1.7 billion). Positive effects from exchange rates, optimized sales revenue and costs, and the efficiency program more than off set the negative effects of the markets in South America and Russia.
Audi lifted operating profit to EUR 4.0 billion (EUR 3.8 billion) due to sales growth, positive changes in the mix and favorable exchange rate movements. Earnings were negatively impacted by high upfront investments in new products and technologies, as well as the expansion of the international production network.
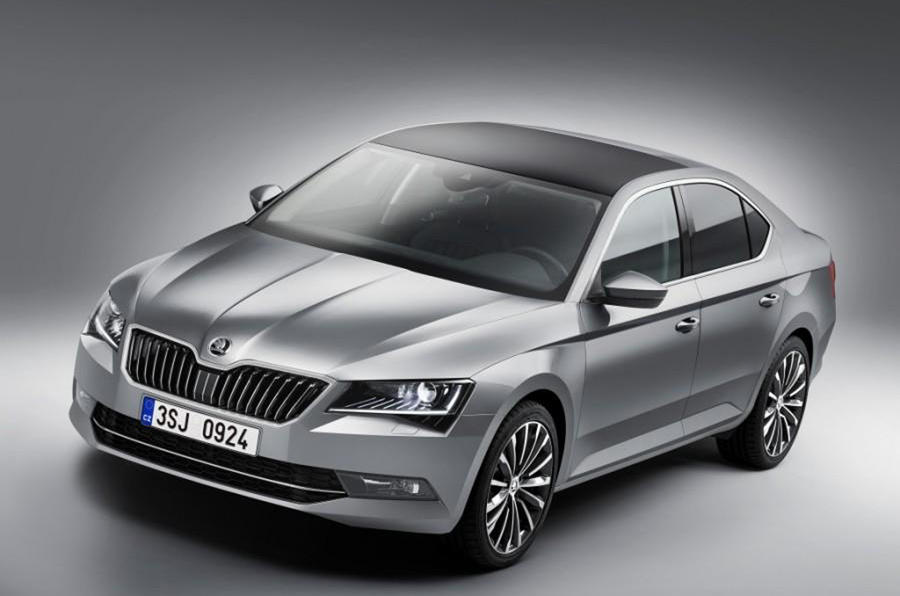
Operating profit at ŠKODA increased to EUR 734 million (EUR 651 million), mainly due to mix effects, optimized material costs and more favorable exchange rates.
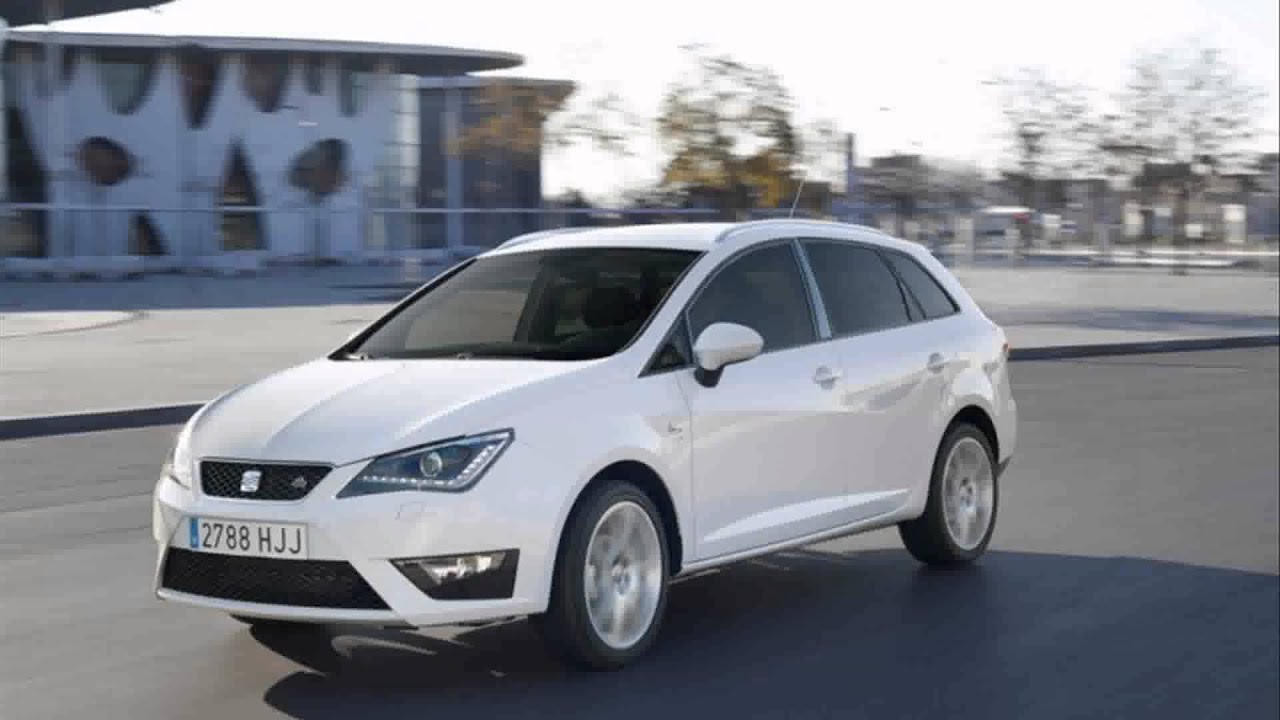
The SEAT brand’s operating profit rose to EUR 12 million (previous year: operating loss of EUR 82 million). This was mainly due to higher volumes, positive exchange rate effects and optimized costs.
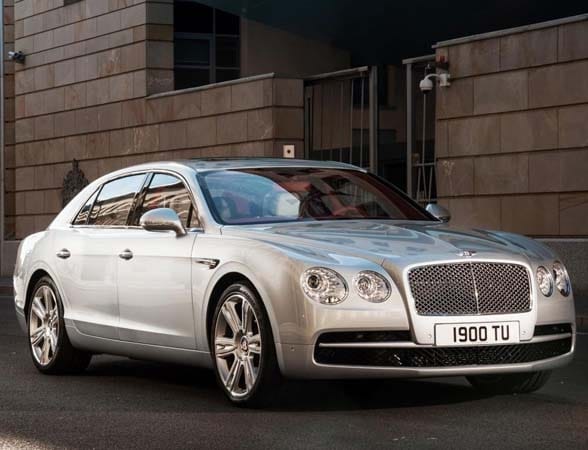
Bentley generated an operating profit of EUR 57 million (EUR 125 million) due to lower vehicle sales and higher upfront expenditures. Exchange rate effects and lower costs were unable to offset this trend.
Operating profit at Porsche improved to EUR 2.5 billion (EUR 1.9 billion) due to volume and exchange rate effects. Porsche’s growth is uniform in the key global markets. Changes to the mix, increased structural costs and higher development costs had a negative impact on earnings.
Volkswagen Commercial Vehicles continued to renew its product range and posted an operating profit of EUR 313 million (EUR 378 million).
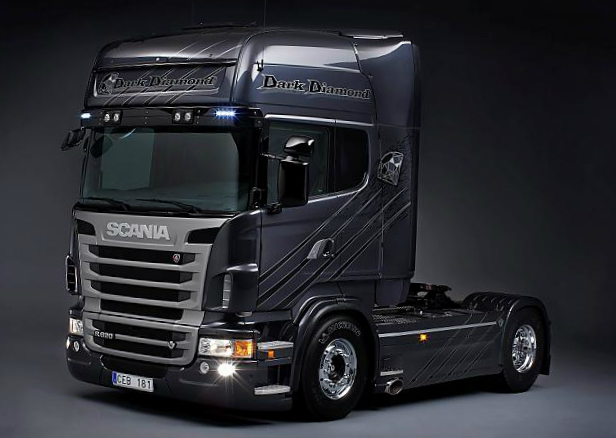
Scania generated an operating profit of EUR 748 million (EUR 700 million); this increase was primarily due to the service business and positive exchange rate effects. MAN’s operating profit before restructuring expenses amounted to EUR 271 million (EUR 304 million). The negative trends in the commercial vehicles market in South America weighed on earnings. Restructuring measures resulted in special items of EUR –170 million.
Operating profit at Volkswagen Financial Services amounted to EUR 1.4 billion (EUR 1.2 billion) on the back of positive volume and exchange rate effects.
Earnings forecast adjusted
The Volkswagen Group expects deliveries to customers in 2015 to remain on a level with the previous year in a persistently challenging market environment.
Depending on economic conditions, 2015 sales revenue for the Volkswagen Group and its business areas is expected to increase by up to four percent above the prior-year figure. However, economic trends in Latin America and Eastern Europe will need to be continuously monitored in the Commercial Vehicles/Power Engineering Business Area.
Because of charges related to the irregularities in the software used for certain diesel engines, we expect 2015 operating profit for both the Group and the Passenger Cars Business Area to be down significantly year-on-year. We expect an operating return on sales before special items of between 5.5 and 6.5 percent for the Group’s operating profit; this will amount to between 6.0 and 7.0 percent in the Passenger Cars Business Area.
| | 2015 | 2014 | % | 2015 | 2014 | % |
| | Q3 | Q3 | | 9M | 9M | |
| Volume data | | | | | | |
| Deliveries to customers | | | | | | |
| (‘000 units) | 2,392 | 2,476 | –3.4 | 7,431 | 7,542 | –1.5 |
| Vehicle sales (’000units) | 2,350 | 2,439 | –3.7 | 7,440 | 7,646 | –2.7 |
| Production (’000 units) | 2,125 | 2,404 | –11.6 | 7,438 | 7,638 | –2.6 |
| Employees | | | | | | |
| (’000 at Sep. 30/Dec.31) | | | | 613.9 | 592.6 | +3.6 |
| | | | | | | |
| Financial data | | | | | | |
| (IFRSs), EUR million | | | | | | |
| Sales revenue | 51,487 | 48,910 | +5.3 | 160,263 | 147,718 | +8.5 |
| Operating profit before | | | | | | |
| special items | 3,206 | 3,230 | –0.7 | 10,197 | 9,416 | +8.3 |
| Special items | –6,685 | – | X | –6,855 | – | X |
| Operating profit/loss | –3,479 | 3,230 | X | 3,342 | 9,416 | –64.5 |
| as a percentage of revenue | –6.8 | 6.6 | | 2.1 | 6.4 | |
| Profit/loss before tax | –2,522 | 3,713 | X | 5,142 | 11,490 | –55.2 |
| as a percentage of revenue | –4.9 | 7.6 | | 3.2 | 7.8 | |
| Profit/loss after tax | –1,673 | 2,971 | X | 3,990 | 8,687 | –54.1 |
| | | | | | | |
| Automotive Division | | | | | | |
| Cash flows | | | | | | |
| from operating activities | 7,420 | 6,556 | +13.2 | 18,973 | 14,942 | +27.0 |
| Cash flows from | | | | | | |
| investing activities | | | | | | |
| attributable to | | | | | | |
| operating activities*) | 459 | 3,929 | –88.3 | 7,220 | 9,398 | –23.2 |
| of which: capex | 2,688 | 2,904 | –7.4 | 7,340 | 6,482 | +13.2 |
| as a percentage | | | | | | |
| of sales revenue | 6.1 | 6.8 | | 5.3 | 5.0 | |
| Net cash flow | 6,962 | 2,627 | X | 11,753 | 5,544 | X |
| Net liquidity | | | | | | |
| at Sep. 30 | | | | 27,755 | 16,785 | +65.4 |
| Net liquidity | | | | | | |
| at Sep. 30/Dec. 31 | | | | 27,755 | 17,639 | +57.4 |
*) Excluding acquisition and disposal of equity investments: Q3: EUR 3,573 million (EUR 3,845 million), January to September: EUR 10,246 million(EUR 9,694 million).
Figures by brand
from Jan. 1 to Sept. 30
| Sales | | Operating | | Operating | |
| | revenue | | profit | | margin | |
| | in € m | | in € m | | in % | |
| | | | | | | |
| | 2015 | 2014 | 2015 | 2014 | 2015 | 2014 |
| | | | | | | |
| Volkswagen Passenger Cars | 79,972 | 73,390 | 2,229 | 1,696 | 2.8 | 2.3 |
| Audi | 43,695 | 39,300 | 4,024 | 3,831 | 9.2 | 9.7 |
| ŠKODA | 9,280 | 8,784 | 734 | 651 | 7.9 | 7.4 |
| SEAT | 6,388 | 5,622 | 12 | –82 | 0.2 | –1.5 |
| Bentley | 1,364 | 1,259 | 57 | 125 | 4.2 | 9.9 |
| Porsche *) | 16,471 | 12,241 | 2,546 | 1,927 | 15.5 | 15.7 |
| Volkswagen Commercial Vehicles | 7,537 | 6,976 | 313 | 378 | 4.2 | 5.4 |
| Scania *) | 7,686 | 7,511 | 748 | 700 | 9.7 | 9.3 |
| MAN | 9,981 | 10,214 | 271 | 304 | 2.7 | 3.0 |
| Volkswagen | | | | | | |
| Financial Services | 19,403 | 16,058 | 1,381 | 1,215 | 7.1 | 7.6 |
*) Including financial services.


.jpg)